“Econometrics is the original data science,” asserts Joshua Angrist, an MIT professor and a Nobel Laureate in the field of Economics. “Before there was data science, there was econometrics.” Historically, econometrics emerged as a separate field in the first half of the 20th century while data science surfaced as a discipline with the start of the 21st Century.
Ragnar Frisch, a Nobel Laureate Economist, is accredited for coining the term “econometrics” – describing the integration of economics, mathematics, and statistics – back in 1926. Data science, on the other hand, arose as a specialism in 2001, crediting the establishment to William S. Cleveland, an American Computer Scientist. The term “data science” was first proposed by Peter Naur in 1974, almost 5 decades after the emergence of econometrics.
The historical timeline of these two subjects, however, is not an adequate explanation of their association with each other – and does not in the least suggest that data science is born out of econometrics. This article, rather than suggesting any causal connection between the two, focuses on highlighting their similarities and differences, along with proposing how a marriage of the skills and techniques under these two fields can bring to bear logically more sound and technically more robust modeling approaches.
Let’s begin with the definitions…
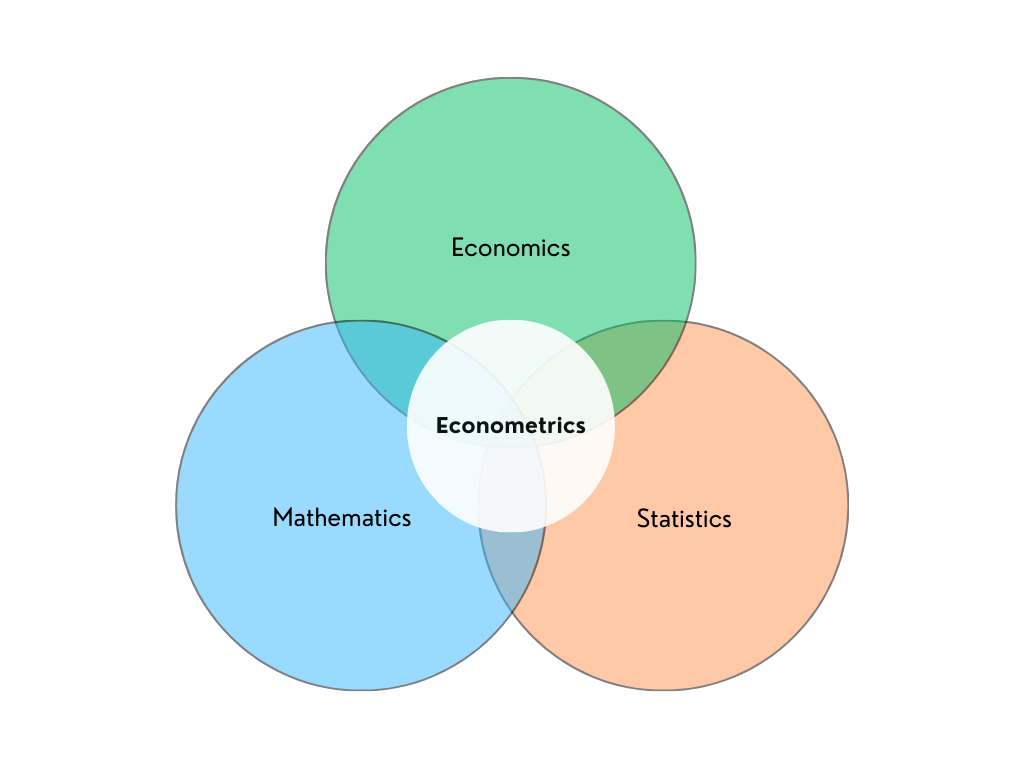
Econometrics is the use of statistical and mathematical techniques to analyze relationships between economic variables. The end goal of such analyses is usually to prove or disprove economic theories, perform forecasting, and suggest actionable policies. Econometrics is, simply speaking, the interaction between economics, mathematics, and statistics.
Data science is the use of mathematical and statistical methods – employed with the knowledge of computing, programming, and artificial intelligence – to analyze (big) data. The end goal is usually to find hidden patterns in data, produce meaningful insights, create accurate machine learning models, and make future predictions. It is, simply speaking, the interaction between mathematics, statistics, and computer science (with a focus on AI/machine learning, computer engineering, and programming).
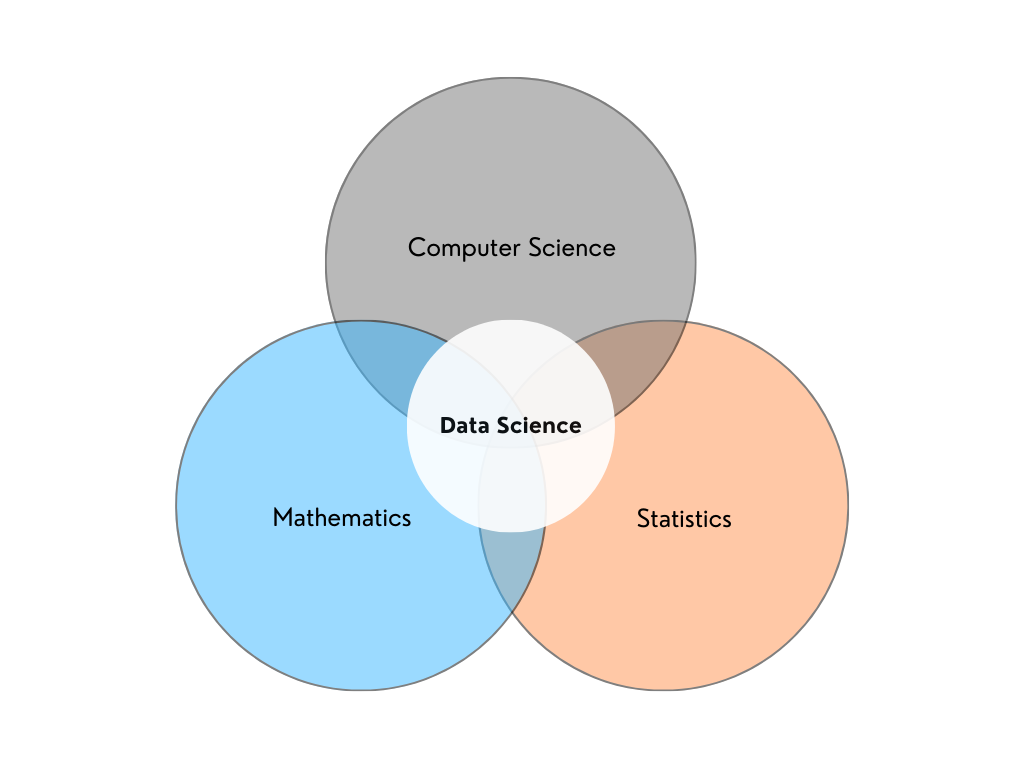
The Venn Diagrams above are in no manner comprehensive in terms of what these fields, separately or combined, entail and can possibly achieve.
Similarities and differences
Econometrics and data science (particularly machine learning) are interested in real-world data and in creating models that explain it as best as possible. The approach employed by the two fields, however, differ in some respects. A few of these are identified below:
Causality & Model-Fitting
Econometricians focus on explaining the relationships between variables to possibly identify causality or to test theory. He or she aims to quantify the “weight” of the effect independent variables have on the dependent variable. The econometrician fine-tunes his or her model to make it consistent with statistical assumptions, so that the resulting parameters or values are unbiased and reliable. Their values help mathematically explain the relationships between the variables under study.
Data scientists (or more specifically, machine learning experts) focus on fitting the model – which is built on advanced statistical and mathematical foundations – with regard to optimizing accuracy (correct prediction) and efficiency (simple solution or model). He or she is not particularly concerned with analyzing each variable or feature’s contribution to the target or predicted variable, as long as the model is performing optimally in giving accurate predictions.
Consider the simple linear regression equation:
y = βX + e
Where y is the dependent/target variable, X is the matrix or vector of independent variables/features, and e denotes the error term. Under correct statistical assumptions, e represents white noise and is random.
An econometrician would first and foremost be interested in the β parameter associated with each independent variable, as it explains each variable’s relationship with y. A data scientist would largely be concerned with the accurate prediction of y, as long as the model obtains a good enough balance between underfitting and overfitting.
Articulation: Visualization & Writing
Data Scientists, owing to their expertise in computer programming and data visualization, are able to capture complex information and messages by creating different kinds of visuals. They are adept at visualization software, which offer multiple and sophisticated ways for graphing, and can even build visuals from scratch, with specific attention to little details and elements, via code.
Econometricians, on account of their background in Research Methods, are adept at technical report writing. Apart from fieldwork, which is primarily the task of researchers that econometricians also learn, they are practiced with interpreting data and variables – and articulate in explaining the theory and empirical results.
Accuracy & Reasoning
Data scientists are mostly concerned with building a model that fits the best and produces the most accurate predictions, regardless of the model specification or algorithm applied. Econometricians are picky here; they are used to giving strong justification behind model specification and the approach employed – oftentimes trading off accuracy for economic reasoning.
Consider the variable ‘age’ in predicting the ‘income’ of an individual. Now also assume that the relationship between the two is non-linear. A data scientist or machine learner, aimed at producing the most accurate model, will include polynomial terms to capture the non-linearity. To decide what power of the age variable to include in the model, he or she will go on incorporating higher degrees, until the model achieves a good enough balance between overfitting and underfitting.
The model will take the form below:
Income = αiAgei + βX + e
Where Income is the target variable, Agei are the successive polynomial terms of the variable age (αi associated with each term), X is the vector of other features in the model, and e denotes the error term. The i subscript and superscript can be 2, 3, 4, and so on – depending on the model’s evaluation done by the data scientist.
The econometrician, similarly, to capture non-linearity, will include higher degrees of the age variable. But he or she will be extremely careful and justify the inclusion of every higher term. Why should we include age-square? A person’s capacity for income generation might be high in the initial stages of their career, but diminish as they grow old. Hence, age might exhibit diminishing returns in relation to income. This is a realistic justification. Hence, we can now include age-square.
What about age-cube? Does the income capacity of the individual shoot up again after a certain age (especially when we’ve assumed it diminishes with age)? That doesn’t seem plausible. Hence, age-cube will not be included in the model. Will that, to the detriment of the model’s performance, impact accuracy? Maybe. But that is how an econometrician approaches modeling. It is rare to see a cube-term in an econometric model.
Modeling Strategies
Data science, particularly machine learning, is rich in terms of algorithms available. These fall under different types – each possessing different applications – including supervised (regression and classification), semi-supervised, unsupervised (dimension reduction, density estimation, market basket analysis, and clustering), and reinforcement learning.
Econometrics, though possessing different modeling strategies, approaches a particular model-building strategy with care – and once that is done, concerns itself with modifying and optimizing the selected model.
Data science tools can store, analyze, and model large amounts of data – in a lot of different ways. This arguably makes data scientists possess technological superiority over econometricians, who are primarily taught to interact with data through spreadsheets and other statistical software (such as Stata or SPSS).
Data Inputs
Data science is open to a wide range of data inputs, including structured (such as tabular data) and unstructured data (like images and audio files). Machine learning algorithms can accept these data inputs, upon proper transformations, and give corresponding outputs.
Econometric techniques, as they are concerned with finding relationships between economic variables, are principally interested in tabular data (numerical and categorical). It might be interesting to include unstructured data in an econometric model using machine learning techniques. To check out an example of this, the readers can review this published paper.
Cross-Learning
Both fields can undoubtedly learn from each other. A data scientist can employ the econometric way to develop a “business sense” – so he or she is better able to explain and understand the causality present in their model. An econometrician can exploit data science and machine learning tools to optimize model performance, exploit efficient technology and software, and achieve better precision.
Hal Varian, Google’s Chief Economist, in his article, Big Data: New Tricks for Econometrics, succinctly explains how both fields overlap and provides specific and practical tips on how econometrics can learn from machine learning techniques.
Of course, a lot of principles and applications in econometrics and data science are disjoint, and there would be little use, if any, to forcefully bring together two fields that are meant to serve differently. However, one cannot turn a blind eye to the overlap of the two fields, which is what we discussed in this article.
Let us take out the circles representing Econometrics and Data Science, from Figures 1 and 2 respectively, and place them in a separate Venn Diagram.
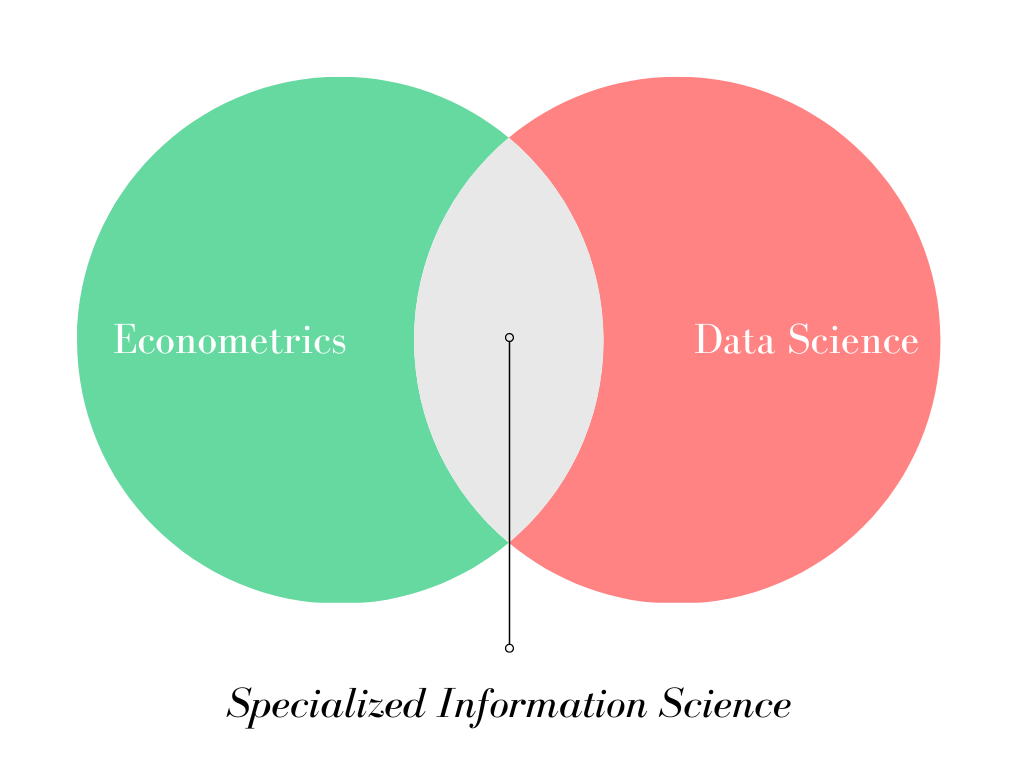
A person who successfully integrates the skills and techniques of both fields – econometrics and data science – and can apply them to solving problems in practical domains, is nothing short of a Specialized Information Scientist. He or she is a technical expert capable of carrying out in-depth analysis of business, social, or economic matters – and propose practicable solutions accordingly.


1 thought on “How are Econometrics & Data Science Related?”
Pingback: How better management produces better data? - Effective Thoughts